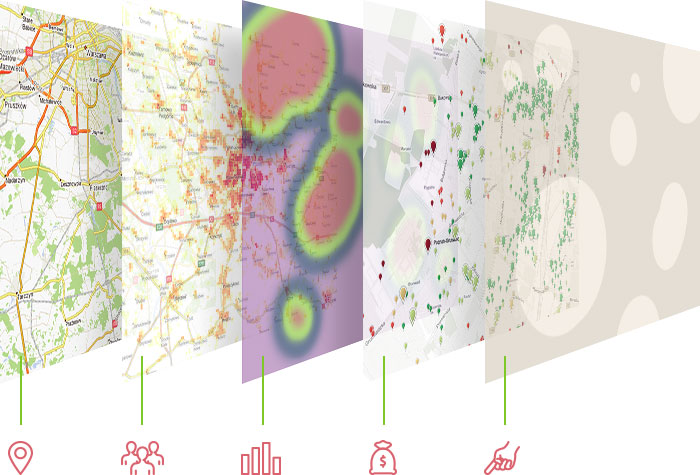
The model is created individually, most often taking into account the following data
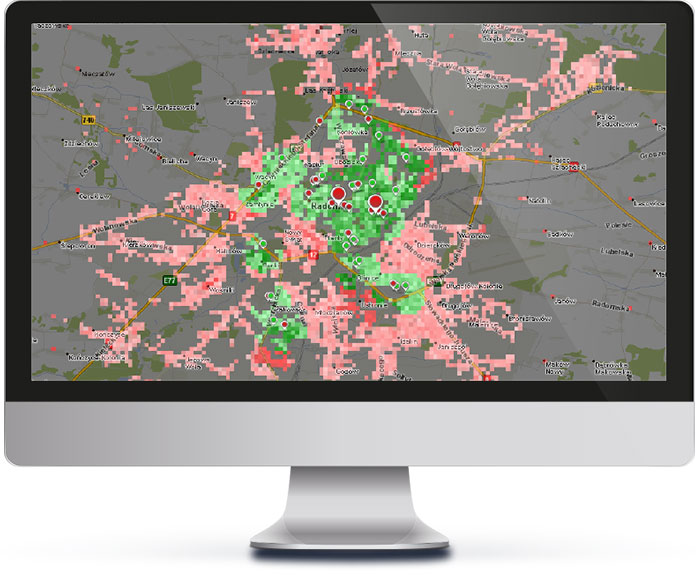
Network coverage analysis
This analysis is used to identify the potential for expansion or modification of the density of existing points of sale. It can effectively identify places that, due to their high profitability potential, are of interest to the customer. Both internal data – the revolving model and external factors – population or purchasing power – have to be taken into account.
- Targeo spatial data (buildings, road network, access times)
- Socio-economic data (population, purchasing power, etc.)
- Analysis of the white-spots competition (own network coverage vs. competition))
- Customer data (revenues, sales volumes, service cost, etc.)
- Manual calibrations (specific location, region, etc.)
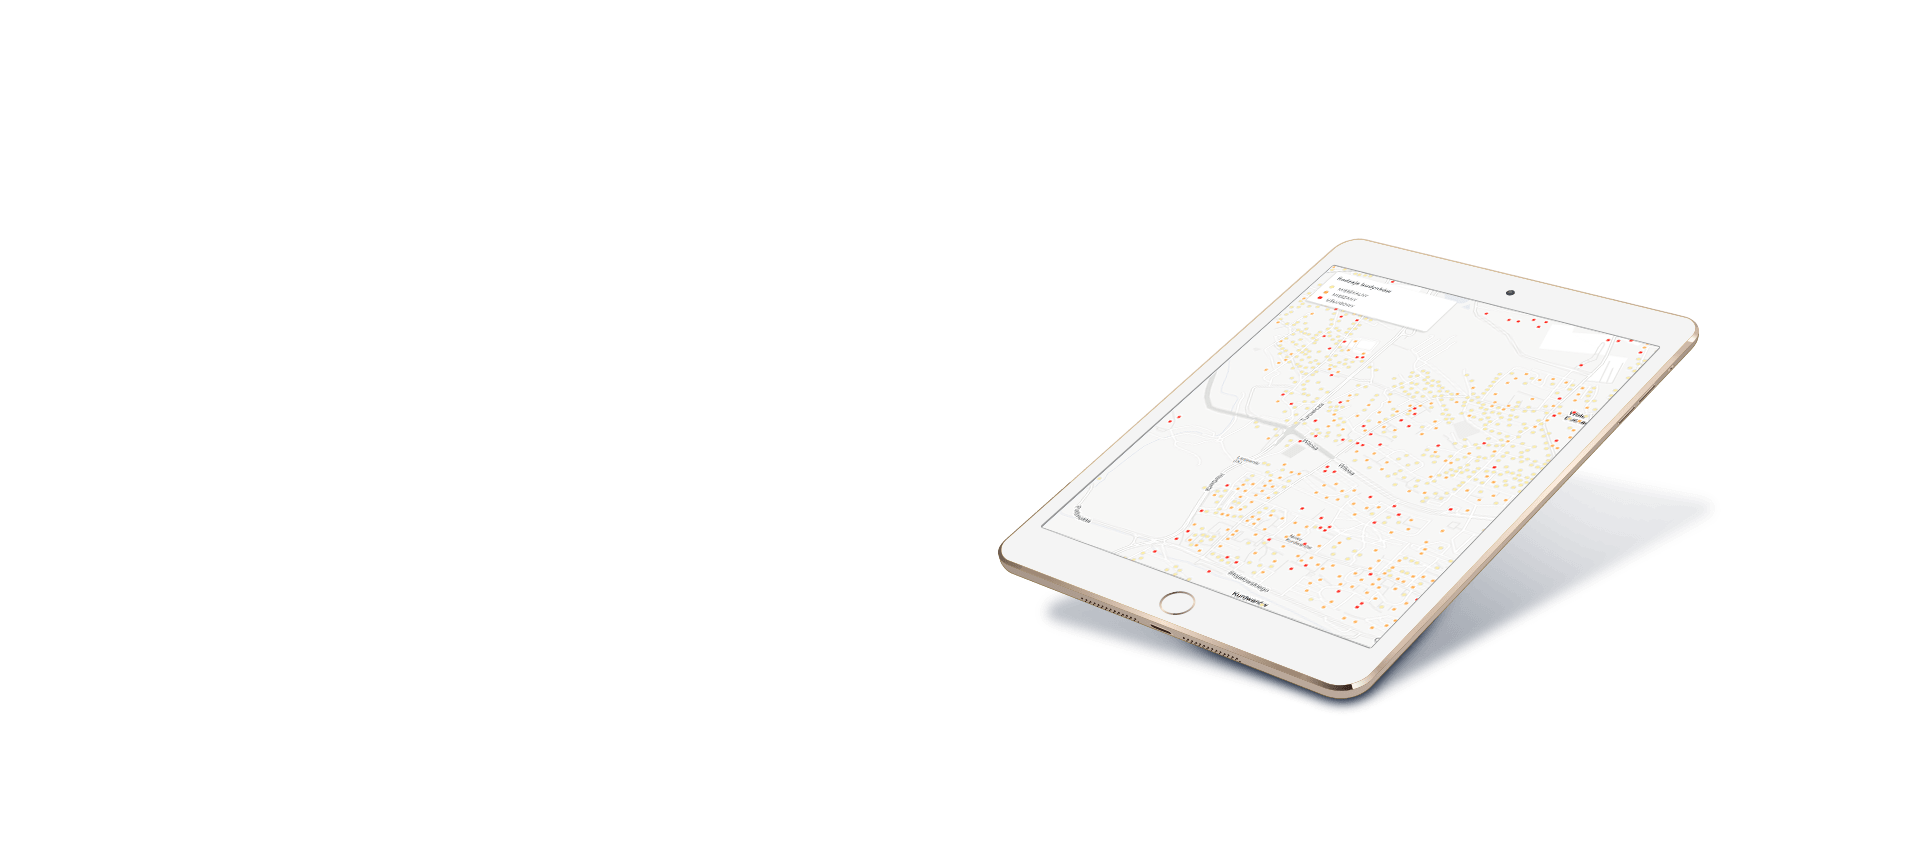
Interaction
zones
The assessment of each Point of Sale (POS) can be based on its sales results combined with an interaction zone, which can be defined, for example, by a pedestrian access zone in 10 minutes. For such a zone, the population and its characteristics (sex/age), purchasing power, points of competition and traffic generators (e.g. bus stop, ATM, cinema, etc.) are calculated.
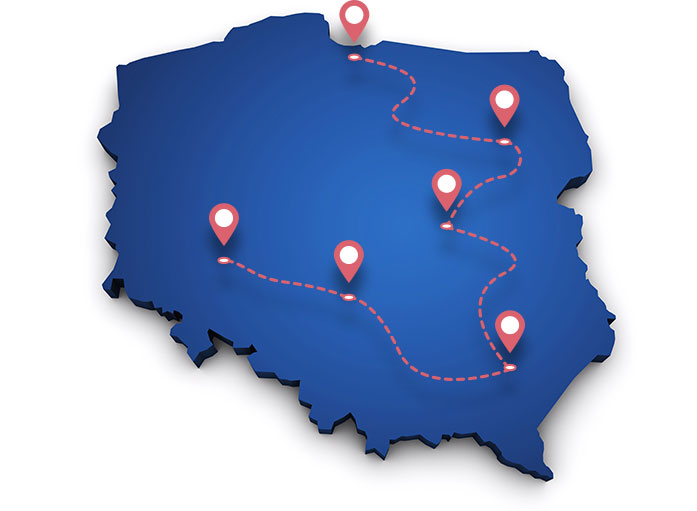
Distribution network
analysis
Logistic analysis can be used for better location of warehouses, logistic centres, branches, etc. Based on historical transport volumes and growth potential, we calculate the most efficient locations and conduct a probabilistic analysis of how current distribution will change if we add a warehouse in a specific location.
In the next step, we focus on optimising routes in order to minimise the driver’s working time or to reduce the number of kilometres to be driven.

Field employees
management
The system makes it possible to plan the routes for a whole week or another cycle. Routes can be planned automatically to optimize working time or kilometres, taking into account time windows (e.g. opening hours) and other criteria (e.g. visit at least twice a week).